Copper is among the most actively used metals and has a very wide range of consumption, that is why the change in copper prices quite clearly reflects the state of the global economy as a whole, correlating well with the world GDP dynamics (Fig. 1) and correlating even better with the manufacturing PMI and oil prices (Figs. 2, 3).
Over the past decade, the copper prices have zigzagged and varied widely. After the global financial and economic crisis of 2008-2009, the copper prices at the London Metal Exchange (LME) recovered very quickly and upsurged until 2011 when the average annual price was $8,821/t. After that, a lengthy period of decline was recorded until 2016 amid a slowdown in the development of the Chinese economy (the largest consumer of copper). In 2016, the average annual price for copper dropped below $5,000 per ton followed by a moderate increase, and in 2017 through 2020, the average annual price varied within the range of $6-$6.5 thousand per ton. In 2021, the copper market began its rapid growth (the average price for the year was $9,315/t), which continued in early 2022, but at a more moderate pace.
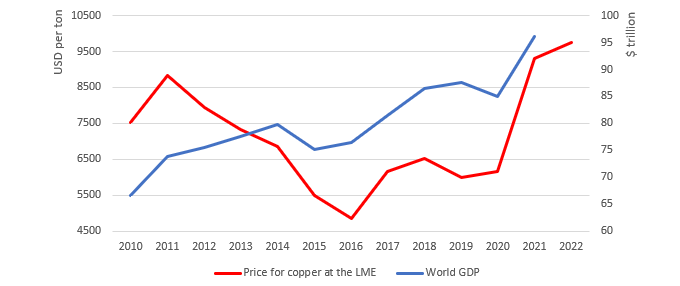
Fig. 1. The dynamics of the average annual prices for grade “A” refined copper at the LME in 2010-2021 and the first half of 2022, ($/t, left) and the global GDP in 2010-2021, ($ trillion, right)
According to LME, The World Bank
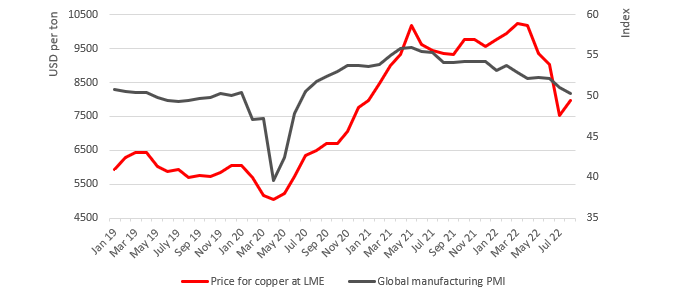
Fig. 2. The dynamics of average monthly prices for grade “A” refined copper at the LME ($/t, left) and the global manufacturing PMI (right) from January 2019 to August 2022.
According to LME, Statista, S&P Global
The copper price is very sensitive to changes both in the industry and in the economy of individual countries and the world as a whole. Let us consider in more detail the influence of various events and factors on price changes in 2019 through 2022, one of the most interesting and dynamic periods for the world red metal market (Figs. 2, 3, 4).
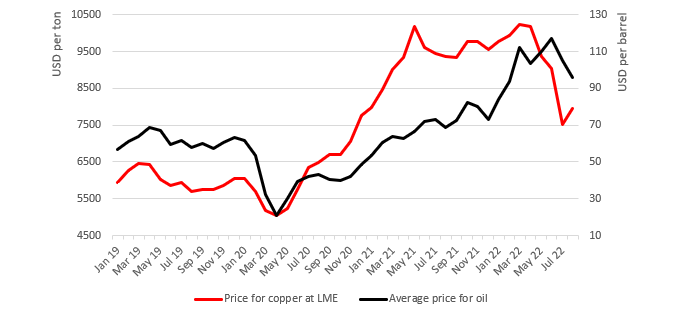
Fig. 3. The dynamics of average monthly prices for grade “A” refined copper at the LME ($/t, left) and average oil prices ($/barrel, right) from January 2019 to August 2022.
According to LME, World Bank
Quiet 2019
In January 2019, the global copper market experienced a moderate uptrend amid the announced ban imposed on importing the low-quality copper scrap from July 2019 by the Chinese authorities resulted in the increased copper concentrate imports. In February, the growth was supported by the suspension of a number of large copper mines in Chile (the world’s largest producer of mined copper) due to heavy rains. Until the beginning of May, prices were at the level of $6,500/t, then they returned to $6,000/t, which was their level in early January. The reason was the beginning of trade wars between China and the United States, and on May 10, 2019, Donald Trump announced a 2.5-fold increase in duties on goods from China to a value of $200 bn. In August, the USA announced another increase in duties on Chinese goods, to a value of $300 bn this time. As a result, the copper price remained at the level of $5,700 to $5,900 per ton, and the inventories at the LME in August were the highest for the period under review amounting to about 300,000 tons.
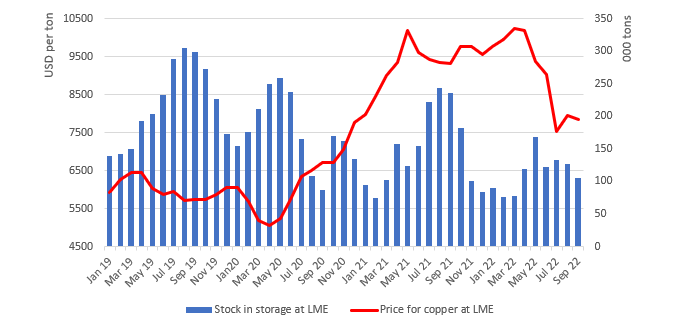
Fig. 4. The dynamics of average monthly prices for grade “A” refined copper at the LME ($/t, left) and its inventories (thousand tons, right) from 01.01.2019 to 09.15.2022.
According to LME
Tough 2020
After the stabilization of the relations between China and the United States in December 2019 - early January 2020, the copper market began to strengthen, but in mid-January, the copper price declined again, by 10% in 10 days due to the COVID-19 pandemic in China. Further, the copper price continued to decline due to the spread of the COVID-pandemic to other countries of the world, and in April, it dropped to its minimum, amounting on average to $5,048/t for the month. The average oil price also dropped to its minimum in April, to $21.04/barrel.
By that time, the peak of the COVID-pandemic in China was already over, the country’s economy began to recover, the market revived, and the copper price began to grow steadily, and in September, it exceeded an average of $6,700/ t, and the copper inventories at the LME decreased to 86.3 thousand tons. In November 2020, copper prices saw a rapid growth. In December, the average monthly price increased by 10% compared to November, up to $7,755/t, and after that, the prices soared. This growth is based on the active climate agenda, which implies an increase in the copper consumption in low-carbon and carbon-free “green” technologies (mainly for electric vehicles), as well as a rapid recovery of the Chinese economy and the expectation of a shortage of copper amid the reduced copper production in Peru, one of the main copper suppliers to the world market. In 2020, the production of mined copper in the country declined by 12.5% due to suspension of work due to the coronavirus restrictions.
Buoyant 2021
In February 2021, the first forecasts were made (by Citigroup and Bank of America) about a possible increase in the copper price to $10,000/t by the end of the year, but they came true much earlier. In March, the average monthly copper price exceeded $9,000/t, and in early April, the rally in copper prices was accelerated by the announcement of the Biden’s infrastructure plan that involved investing $174 bn in the development of electric vehicle markets. At the beginning of May 2021, the copper price hit $10,000/t, and averaged $10,184/t for the month. Fig. 2 shows that the boom in the copper price was accompanied by strong growth in business activity in the manufacturing sector, expressed by the manufacturing PMI. After reaching the peaks in mid-May, the copper prices began a corrective decline and in July, they did not rise above $9,800/t, and by August-September, they dropped to the level of April 2021.
In October 2021, another rise started amid the emerging energy crisis in the Asian countries and the expectation of a shortage in the metal production as one of its consequences, since copper smelting is an energy-intensive process. To meet the demand for copper and to stabilize prices, the Chinese authorities brought 150 thousand tons of copper from their state reserve to the market, announcing that such measures would be applied in the future, however, the price at the LME continued to grow and jumped to $ 10,500/t in mid-October. In November, the high price level was supported by the expectation of a shortage due to the suspension of work at the Peru’s largest copper mine, Las Bambas, where a strike began earlier in the month. By the end of 2021, the price corrected and averaged $9,550/t for December.
Unpredictable 2022
In January 2022, an article by A. Usmanov about the upcoming shortage of copper in the global market was published on the World Economic Forum’s website. Subsequently, the article was deleted, but it was actively quoted in the media, especially in the Russian ones. In this article, the owner of USM Holdings Ltd, one of the assets of which is the Udokan copper deposit, the largest in Russia and one of the largest in the world, called copper “new gold”, “new oil” and the “metal of the future”. Around the same time, a study by the consulting company Rystad Energy was published (interestingly, it was also removed from the official website of the company), which predicted a copper shortage of about 6 mn tons by 2030. Along with the reduction in copper production in Chile in January by 7.5% compared to January 2021 and negative forecasts for the year, as well as rapidly declining inventories of copper at exchanges, all this led to another increase in prices.
At the end of February, this growth continued amid the shutdown of the large Peru’s mine Cuajone due to a strike, the beginning of the special military operation and the emerging concerns about a ban on the supply of the Russian copper to the EU countries. On March 7, 2022, the price of copper renewed its historical high and reached $10,730/t. The LME copper price was above $10,000/t for most of March and the first two decades of April, and then it began to fall as rapidly as it had risen in the first half of 2021. From April to July 2022, the average monthly copper price dropped by 26%, from $10,183/t to $7,530/t, and it declined even to $7,000/t in mid-July. Such a sharp drop is mainly attributed to a new wave of the COVID-19 pandemic in China in late March - early June 2022, which was much more severe in terms of the number of cases than the first COVID-wave in early 2020. This time, the China’s economic recovery was slower than it was expected; however, in August, the average monthly price rose by almost 6% compared to July, up to $7,961/ton. In the first two weeks of September, the average copper price remained at about the same level, having decreased by 1.5%.
Based on the above, a conclusion can be made that the copper price is mainly determined by the following factors:
• the state of the China’s economy, the main consumer of copper and producer of refined metal,
• the socio-political state of Chile and Peru, the main producers of mined copper,
• the development of low-carbon and carbon-free “green” technologies, primarily, the production of electric vehicles.
Interestingly, the analysts put the last of these factors at the forefront when calculating the expected demand for copper in the future, and the energy crisis in Europe put the planned decarbonization and scaling of these carbon-free technologies into question. In this regard and also taking into account the unstable geopolitical situation and very high volatility, it seems too early to talk about copper as “new gold”. At the same time, it seems obvious that a wide range of copper applications in industry will not allow it to be left out, and the price trend for the metal in the future will be upward.
Anastasia Smolnikova, expert analyst at the Institute for Natural Monopolies Research for Rough&Polished
