An important role in the development strategy followed by diamond cutting companies is played by research of the sales market where their goods are traded aimed at defining quantitative and qualitative indicators of such a market. It is noteworthy that one of its major characteristics is the distribution of personal income in a country or area, which determines the production potential. Despite the large number of studies and availability of statistics on the subject, their practical application requires an effort to solve a range of problems and is prominently relevant to the organization of trade in diamonds.
To evaluate the efficiency of sales effected by Yakut diamond cutting companies operating in this region we shall review the performance of diamond cutting and jewelry industries in the Republic of Sakha (Yakutia) in 2005-2010 (Table 1).
Table 1
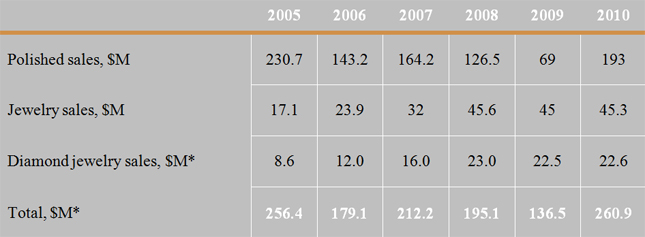
According to the Ministry of Economy and
* Authors’ estimate
There are a number of well-known methods to study the distribution of personal income in various countries and areas. The dependence, which shows what part of the aggregate income is received by every group of population in a country (region), is called the Lorenz curve. The Gini coefficient, which is a measure of the inequality of a distribution, is used to describe the distribution of aggregate income between population groups. The higher the coefficient, the greater the inequality, that is, the higher the degree of society polarization in terms of income, the closer the Gini coefficient is to 1. If incomes in society tend to parity, this indicator tends to zero. In studies on the distribution of income people are usually divided into a certain number of income groups (quintiles), as a rule into five or ten equal parts by the number of persons. The correlation between the incomes received by the richest 10% and the incomes received by the poorest 10% is a decile coefficient or coefficient of funds, characterizing the degree of income disparity [1].
Statistical compilations usually give the distribution of population segments as a percentage, according to their level of income divided along a certain scale, for example, from 0 to 1,000 rubles, 1000-2000 rubles, 2000-4000 rubles, etc. However, in various books and publications the scales do not match, which makes their comparison quite difficult. Since the figures in statistical tables do not correspond to the conventional quantile division of incomes and because it is impossible to plot the Lorenz curve for graphical analysis, it is necessary to perform some preliminary calculations.
Firstly, personal incomes must be averaged to match the applied scale of income distribution:
di av. = (di + di +1) : 2 , rubles.
Secondly, we have to determine the maximum average income of a country (region), using the average per capita income – dav. .
dmax av. = (100 ∙ dav. - Σ γi ∙ di av.): γi +1, rubles.
Further, using the obtained values we have to plot the dependence of a population group on the average per capita income, γ = f (d).
Then using the obtained curve we can determine the required values of personal income distribution within a country or region.
The statistics describing the average monthly income in the Republic of Sakha (Yakutia) in 2004-2008 was used to plot the dependence curves shown in Fig. 1.
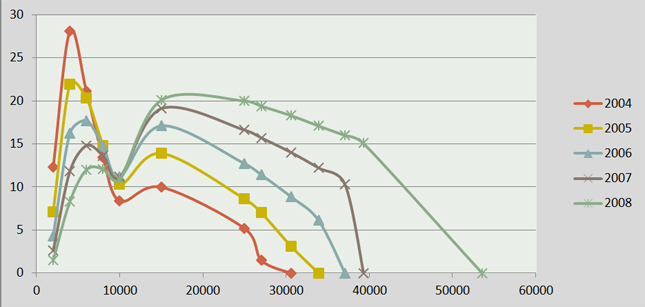
Fig. 1. Distribution of the population in the Republic of Sakha (Yakutia) by the average monthly income per capita in 2004-2008, rubles.
The results show that in those years there was a steady growth in incomes. However, such a distribution (two peaks) shows that the population is stratified into rich and poor. Based on these findings, we assume that purchase of luxury goods, including diamonds, may be afforded only by the "rich" part of the population with incomes exceeding 20,000 rubles. These people can spend up to 2% or one fiftieth of their income for purchasing diamonds and diamond jewelry. This calculation proves that implicitly the population in the Republic of Sakha (Yakutia) may buy polished diamonds and diamond jewelry spending the following amount of money:
P = 0.02 • Σ γi rich • di av. rich • 12 • N , rubles.
Where: P is the potential purchasing power for goods produced by the diamond cutting and jewelry industries of the region;
γi rich - the part of the population earning over 20,000 rubles;
di av. rich – the average monthly income in rubles earned by the part of the population with incomes over 20,000 rubles;
N – the number of population in Yakutia equal to 950,000 people.
Substituting the values from the chart in Fig. 1 for 2008 we have: P = 3.46 billion rubles or more than 100 million U.S. dollars.
Given that sales of goods produced by the diamond cutting industry in the Republic of Sakha (Yakutia) account for less than 10% of its output, it is obvious that the capacity of the local market, which can consume up to 50% of polished diamonds, is not used to its full extent.
Yuri Danilov, Ph. D., Lead Research Fellow, Institute for Regional Economics of the North
Nikolai Konstantinov, Senior Research Fellow, Institute for Regional Economics of the North
