ALROSA Group
Since the hands-on experience of the De Beers Group was widely used to establish and develop the rough and polished diamond complex in this country, the ALROSA Group is structurally identical to the above mentioned holding (Fig.1). If the former monopolistic nature of the diamond business allowed the Russian rough and polished diamond complex to preserve an important place within this business, the current aggravation of competition makes evident the necessity to opt for a new strategy, which will not only permit to win leading positions, but also to exert active influence on rough diamond pricing.
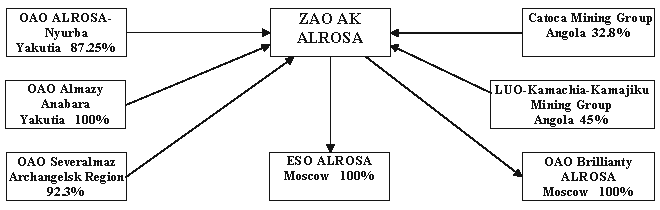
Fig. 1. Diamond business pattern of the ALROSA Group.
Tables 1 and 2 contain basic economic and performance indicators of the ALROSA Group as a whole and those of separate diamond mining enterprises in 2006-2007.
Table 1
Basic economic indicators of the ALROSA Group in 2006-2007
|
Denomination of indicators |
2006 |
2007 |
|
Diamond output, USD million |
2 779.4 |
2 910.3 |
|
Diamond sales, USD million |
3 370.8 |
3 346.1 |
|
Earnings, USD million |
4 262.0 |
4 396.3 |
|
Net profit, USD million |
950.7 |
811.1 |
Table 2
Performance indicators of diamond mining companies (DMC) belonging to the ALROSA Group in 2006-2007
|
|
ZAO AK ALROSA
|
OAO ALROSA-Nyurba |
OAO Almazy Anabara |
OAO Severalmaz*
|
Angola (Catoca Mining Group only) |
Total of ALROSA Group DMC |
|
Rough processing, thousand tons |
32 900 33 000 |
2 780 2 850 |
1 320 1 650 |
860 1 000 |
10 450 11 080 |
48 310 49 580 |
|
Diamond output, USD million |
1 795.2 1 798.1 |
537 572.3 |
81.4 102.1 |
37 50 |
365.8 387.8 |
2 779.4 2 910.3 |
|
Diamond products sales, USD million |
2 225.8 2 129.5 |
638.7 663.1 |
80.5 102.1 |
- - |
425.8 451.4 |
3 370.8 3 346.1 |
|
Net profit, USD million |
572.4 552.7 |
245.9 118.2 |
11.4 14.6 |
- - |
104.9 111.2 |
934.6 796.7 |
* Author’s estimation
ZAO AK ALROSA
As mentioned above, the production pattern of the company itself is also identical to that of the leading company of the De Beers Group - Debswana (see Fig. 2).
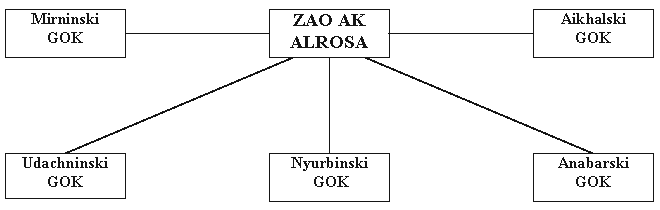
Fig. 2. Pattern of diamond mining divisions of ZAO AK ALROSA.
Tables 3 and 4 contain general basic performance and economic indicators of ZAO AK ALROSA and those of diamond mining divisions in 2006-2007, which clearly show that taken as a whole ZAO AK ALROSA is identical to Debswana in terms of overall production and financial indicators.
Table 3
Performance indicators of diamond mining divisions of ZAO AK ALROSA in 2006-2007
|
|
Anabarski GOK |
MirninskiGOK |
AikhalskiGOK |
UdachninskiGOK |
NyurbinskiGOK* |
ZAO AK ALROSA |
|
Diamond output, USD million |
49.7 52.5 |
592.3 555.5 |
360.4 379.1 |
792.8 810.9 |
537 572.3 |
1795.2 1798.1 |
|
Mined rock, thousand m3 |
1714 2237 |
6881.8 6991.6 |
23799.4 22640.1 |
4666.5 5474.4 |
8559.1 8769 |
45620.8 46112.1 |
According to the annual reports of ZAO AK ALROSA in 2006-2007.
* Diamond mining is related to OAO ALROSA-Nyurba.
Table 4
Basic economic indicators of ZAO AK ALROSA in 2006-2007
|
Denomination of indicators |
Unit of measure |
2006 |
2007 |
|
Diamond mining |
USD mio. RUR mio. |
1 795.2 48 793.5 |
1 798.1 45 977.4 |
|
Sales of basic products |
USD mio. RUR mio. |
2 366.9 64 332.3 |
2 285.7 58 445.3 |
|
Earnings |
USD mio. RUR mio. |
2 790.6 75 847.3 |
2 811.7 71 894.4 |
|
Production costs |
USD mio. RUR mio. |
2 267.9 61 640.7 |
2 289.5 58 542.5 |
|
Gross profit |
USD mio. RUR mio. |
1 537.2 41 780.1 |
1 452.0 37 127.2 |
|
Taxes accrued
|
USD mio. RUR mio. |
837.6 22 766.0 |
600.0 15 344.2 |
|
Net profit |
USD mio. RUR mio. |
572.4 15 558.8 |
552.7 14 132.9 |
|
Issuer’s net asset value
|
USD mio. RUR mio. |
3 451.2 93 803.8 |
4 131.5 105 643.6 |
|
Capital investments |
USD mio. RUR mio. |
481.5 13 087.1 |
682.1 17 440.5 |
|
Geological exploration |
USD mio. RUR mio. |
82.0 2 229.0 |
97.6 2 496.1 |
Besides, if we examine the inter-temporal changes of basic economic indicators in the national currency, we shall see they are decreasing due to the company’s overall transfer to less productive underground mining on the diamond fields developed earlier. This trend will be preserved in the future because of the decreased output yielded by these unique diamond pipes with high diamond content and the necessity to put other less prolific diamond fields under development.
To improve its competitiveness, the company operating when all the aspects of the diamond business are influenced by globalization should drastically change its strategy of development, which may possibly involve transformation of its structure. In our opinion, there is a promising outlook for a cluster approach, which will allow another view on the development perspective of the enterprise and its role in the diamond business and will permit to establish proper relations with government and other institutions.
Studying the experience of work practiced by Debswana, the De Beers Group and Anglo American Holding should not be accompanied by dull copying and imitating the ways of the major competitor, as it happened in the past, but should probably lead to using it to one’s own purposes taking account of its strong and weak points. All the more so, if one takes into consideration that the mentioned holding group is private and striving to obtain maximum profit and capitalization, whereas the ALROSA Group is more of a government company.
The practice of work of such companies in Russia shows that, on the contrary, they are striving to increase their costs and expenses. Evidently, this is the reason for wonton growth of hierarchy structures and management functions and for that of ALROSA’s management salaries, which has already resulted in social tension at the enterprise and in the area. In this sense, the company’s management should be similar to the management structure of Debswana and solve purely technical and production related problems.
Yuri Danilov, Senior Research Fellow, Department of Rough and Polished Diamonds Complex Economy, Institute for Regional Economics of the North (Federal State Scientific Entity)
