The past year for the world's major diamond mining companies was the time of recovery used to restore their pre-crisis performance indicators. In meeting these targets the most successful of them all was De Beers, whose overall performance reached the level of 2007-2008 even without bringing the volumes of production to their previous level (see Tables 1 and 2).
Table 1
Key economic indicators of De Beers in 2007-2010

According to the annual reports of De Beers issued in 2008-2010
Table 2
Diamond output of De Beers in 2008-2010 split by mine fields and divisions
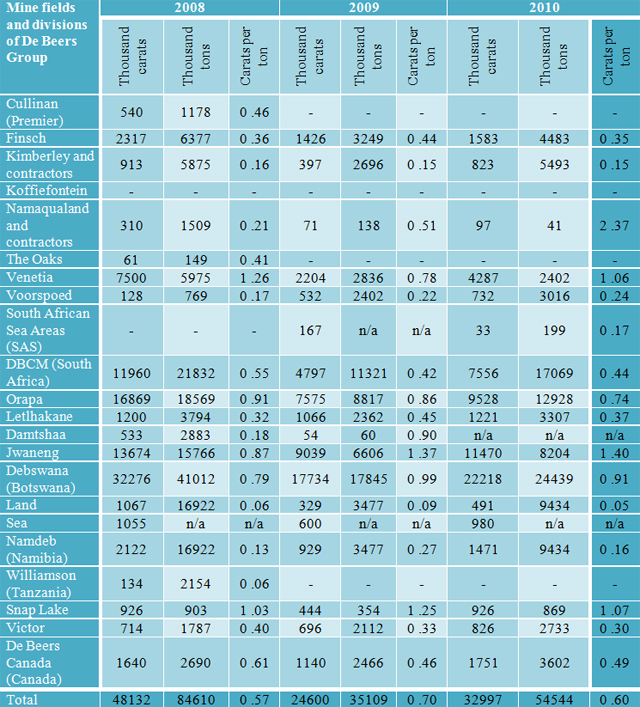 According to the annual reports of De Beers issued in 2008-2010
The current pattern of De Beers Group’s diamond business is shown in Fig. 1.
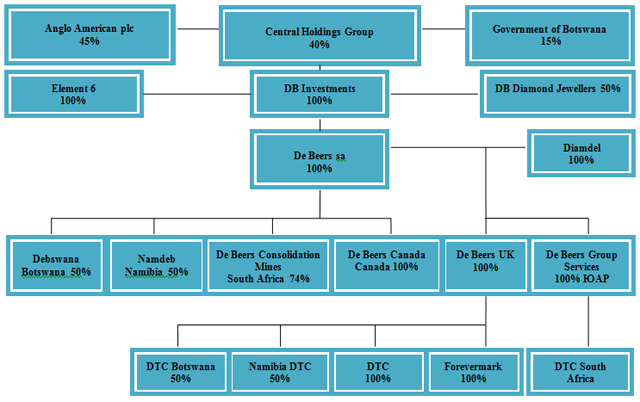
Fig.1. De Beers pattern
Diamond mining by De Beers and its subdivisions
Debswana
The major unit of the Group, Debswana (where 50% is owned by the Government of Botswana and 50% by De Beers), is mining diamonds in 4 mines (Fig. 2, Table 3). To date, its share is two thirds of the Group’s diamond output. By the cost of mined diamonds, Botswana is re-emerging as the top producer in the world, though it is significantly inferior to Russia by volume.
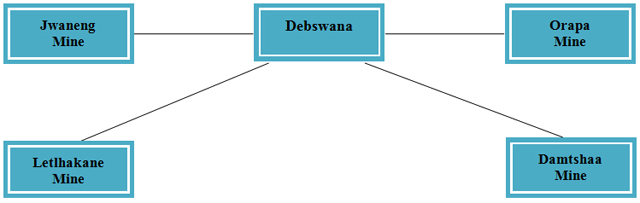
Fig. 2. Debswana’s diamond mining divisions
Table 3
Debswana’s performance by diamond mines in 2008-2010
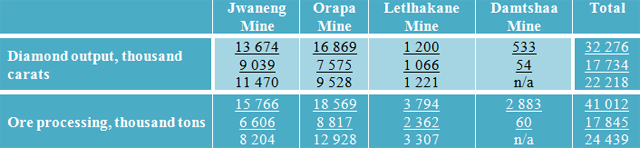
* - 2008
** - 2009
*** - 2010
De Beers Consolidation Mines (DBCM)
The oldest operation of the De Beers Group is mining diamonds in South Africa at the two old mines which are Finsch and Kimberly and in four new areas: Oaks, Venetia, Voorspoed and the coastal zone of South Africa. In 2006, the company discontinued production of ore at Koffiefontein, where the first diamonds were mined as early as 1870, and in 2009 at Cullinan, which were sold to Petra Diamonds. In 2011, De Beers Consolidated Mines sold the Namaqualand mines located in South Africa to Trans Hex Group Ltd (Fig. 3, Table 4).
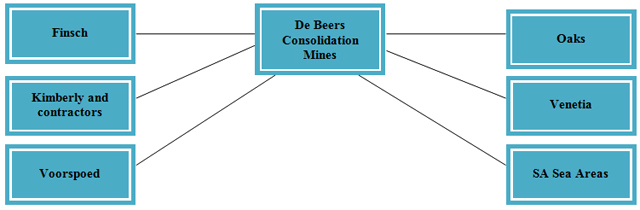
Fig. 3. Diamond mining divisions of De Beers Consolidated Mines
Table 4
Performance of De Beers Consolidated Mines by diamond mines in 2008-2010
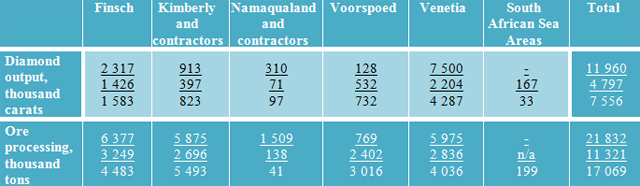
* - 2008
** - 2009
*** - 2010
De Beers Canada
The operations of De Beers Canada are mining diamonds in Canada (Fig. 4, Table. 5). In the future diamond mining in Canada is expected to some extent to offset lower output in the old fields, which are gradually being depleted.

Fig 4. Diamond mining pattern of De Beers Canada
Table 5
De Beers Canada’s performance in 2008-2010
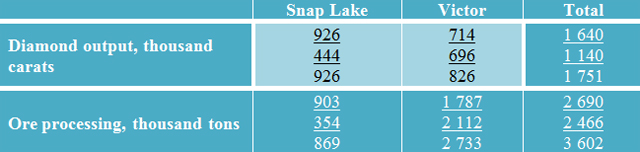
* - 2008 г.
** - 2009 г.
*** - 2010 г.
Namdeb
Namdeb, a joint venture between De Beers (50%) and the Government of Namibia (50%), is mining diamonds on underwater oceanic and on-land alluvial deposits in this country (Fig. 5, Table 6).

Fig. 5. Diamond mining pattern of Namdeb
Table 6
Namdeb’s performance by diamond mines in 2008-2010
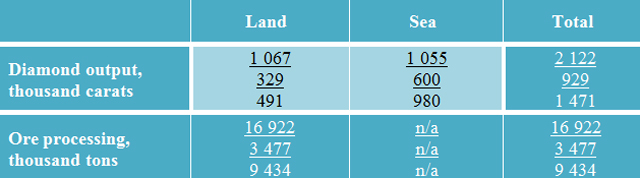
* - 2008 г.
** - 2009 г.
*** - 2010 г.
Yuri Danilov, Ph. D., Lead Research Fellow, Institute for Regional Economics of the North
