The world gold market considered as a whole includes the entire turnover system of this precious metal – its production, distribution and consumption (Figure 1).
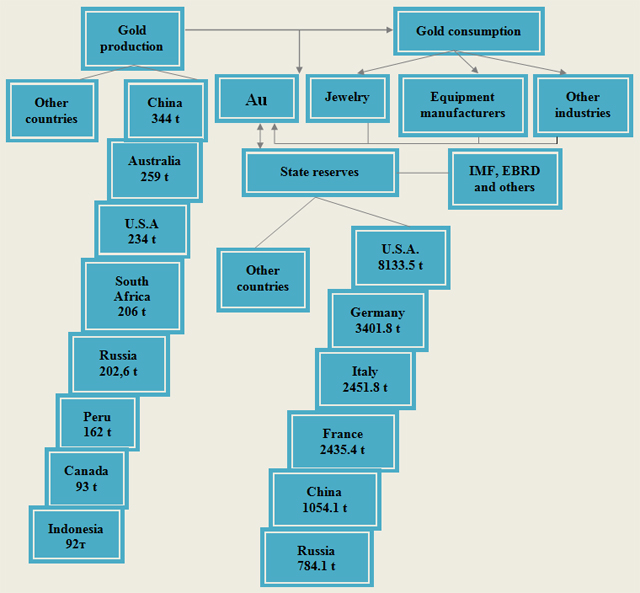
Figure 1. Global gold market, 2010.
The main portion of gold supply falls on its mining output, but its volumes do not change drastically, consequently, the supply of mined gold does not vary much from year to year. The supply of scrap gold which people have as jewelry pieces, coins, etc., part of which goes to the market, and the gold sold by banks and investors changes depending on the state of the market. The gold price is determined by market when buying or selling gold that is considered as a commodity at the national and international levels. The price depends on the demand for the metal and its supply in the course of trade at international gold exchanges.
The review of world trends in the development of gold mining and exploration over the last 30 years shows that the trends are actively both for increase and decrease of gold production. Multiple rise in the market gold price had recently a cardinal impact on the activity of gold producers in the majority of countries in the world. It has become profitable to recover depleted ores and the ones difficult to beneficate, utilize off-balance gold reserves (earlier considered as unsuitable for mining due to engineering, technological and economic considerations), restart the operation of earlier shut-down or dormant mines, pits and dumps; recover dumps and tailing piles of many ore-dressing and processing enterprises containing certain quantities of metals (as by-products or non fully extracted during the primary treatment).
Radical changes in the metal recovery processes thanks to heap leaching, cyanide heap leaching and biological leaching in columns, improvements in other pyro- and hydrometallurgical methods (for example, pressure benefication of refractory hard ores) made it beneficial to recycle the depleted ores and tailings of gold recovery factories with the gold content of 0.5 to 0.1 gramme per tonne and below.
The geographical structure of gold mining in the world has changed greatly over the last three decades. Thus, in 1980, the total gold production in Western countries was 944 tonnes, with the 675 tonnes (over 70%) produced in South Africa. By 1990, the situation changed drastically. The South Africa remained the largest gold producer, but its output fell down to 605 tonnes (35 % of the total gold production in Western countries). Meanwhile, gold production in Western countries increased by 83 percent as compared to 1980 and made up 1 775 tonnes. Gold production rose fast - in the United States up to 294 tonnes (ten times the level of 1980), in Australia up to 244 tonnes (14 times), in Canada up to 169 tonnes (3,5 times). New large-scale gold producers emerged in the southwest region of the Pacific Rim – Philippines, Papua New Guinea and Indonesia. Gold production grew rapidly in Latin America. From 1992 to 2005, gold production increased by almost 850% in Peru, by 368% in Indonesia, by 180% in China, over 100% in Mexico, 10 times in Mali, while gold mining industries were set up in Argentine and the Kyrgyz Republic, but the world’s increase was 8.7% only. Meanwhile, gold output in South Africa kept on falling dropping by 50% over the decade, and even though in 2002 metal production increased for the first time over 9 years by 1% as compared to 2001, in 2003 gold output in the country fell down again.
Within the period of substantial and long gold price decline (1996-2001), gold-miners markedly cut per-unit costs, both current expenses and investments. This was achieved by decreasing exploration, shutting down non-profitable mines, introducing capital- and labour-saving technologies, accelering development of gold production in low-cost labour countries. In the 1980s, main gold production growth was provided by the USA, Australia and Canada, but from the mid-1990s, gold production in these countries stabilized and then decreased. Meantime, gold production grew fast in China, Indonesia, Peru and Ghana. In recent years, gold miners started to merge. Large-scale companies have advantages being capable of raising money, pursuing their research and technical policy, diversification of their political and economic risks. The recent structural shifts from higher developed Western countries to the emerging countries, whose advantages lie in low-cost labour, cheap power, etc., reflect higher competitiveness in gold mining and production.
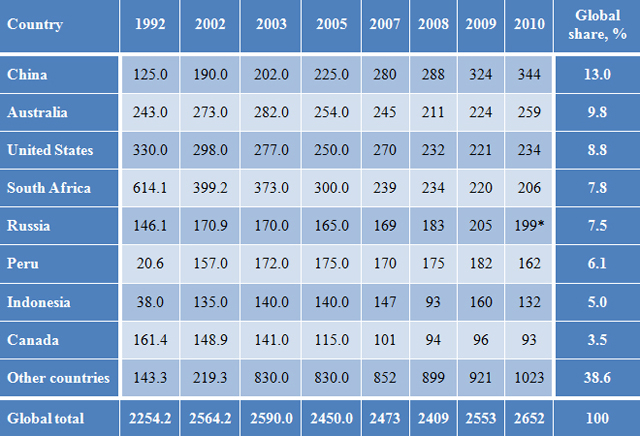
Significant changes affected the territorial structure of gold production in the third millennium, when fast-growing China jumped to the first place in gold mining. In recent years, the world gold mining industry, in spite of the global economic crisis of 2007-2009, has been developing dynamically due to growing gold prices (Table 1).
Table 1
Gold output in major gold producing countries in 1992-2010, tonnes
Sources: 1992-2005, http:/minerals.usgs.gov/minerals/pubs/commodity/
2007-2010 – based on the GFMS Gold Survey data
* According to Gold Producers Union, gold production in Russia in 2010 amounted to 202.6 t
According to GFMS (Gold Fields Mineral Services), global gold output in 2010 rose by 2.6 percent to 2,652 tons, mainly driven by Australia, China, Argentine and the United States. Indonesia, Peru and South Africa posted decline in gold output. Russia ranks fifth among the gold producing countries (Table 1). According to other sources, Russia took the forth place having outperformed South Africa (202.6 tonnes and 198.8 tonnes, respectively).
Gold miners supplying main gold quantities to the market have little opportunities to influence the gold price and have to adapt to big price fluctuations, decrease their per-unit costs if prices go down to ensure their profit margin in a crisis environment.
The average annual price for gold in 2010 compared to the previous year grew 26% to $1,224.5 per troy ounce, and by 21% in roubles, to RUB 1,197.3 per gramme. The upside trend has been for a decade already, and the absolute price growth in 2010 (+$251.17 per ounce) was a record one. The demand dynamics and macroeconomic factors keep on fuelling gold attractiveness.
The following companies (Table 2) set the pace in gold mining – like last year - Barrick Gold, Newmont Mining, AngloGold Ashanti and Gold Fields producing over 100 tonnes of gold per year. For the first time, based on the results of 2010, OAO Polus Zoloto aspires for 10th place in the rating of major world gold mining companies.
Table 2
Gold output of major gold producing companies in 2009-2010 (according to GFMS)
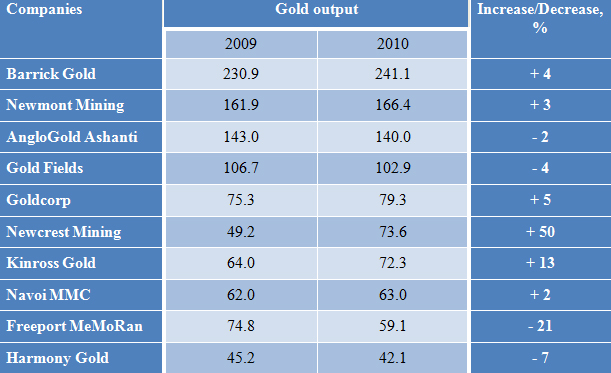
Note: based on the results of 2010, OAO Polus Zoloto increased the gold production by 10% (from 39.2 tonnes in 2009 up to 43,1 tonnes in 2010), and is to take 10th place in the rating of major world gold mining companies.
Jewelry industry is the main gold consumer, where demand is governed by gold price to a great extent, the lower the price the higher the demand. But this regularity is valid in periods of economic growth, while in recession periods demand from the jewelry industry declines even if gold prices are relatively low. It should be taken into account that the population has significant quantity of gold as jewelry pieces, coins etc., part of which also goes to the market.
From the macroeconomic point of view, the situation can be seen as follows. The main portion in gold supply comes from gold mining, but these volumes are rather inertial, so the supply of mined gold varies relatively little as compared to the supply of scrap gold and gold sold by bankers and investors.
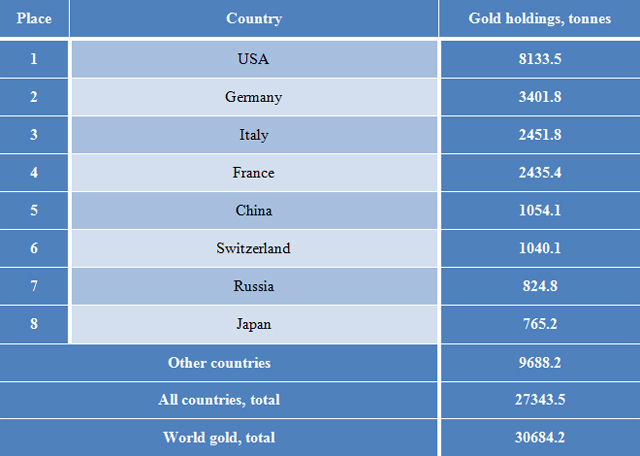
So far, gold is used practically by all the countries as an insurance and reserve fund ensuring the state’s financial system sustainability. Calculated state gold holdings accumulated by central banks, the IMF and regional development banks amount to over 30,000 tonnes (Table 3).
Table 3
Gold holdings in state reserves across the world (July 2011)
According to World Official Gold Holdings. International Financial Statistics, June 2011
Over the last years in the third millennium, Russia has been steadily increasing its gold reserve thanks to higher prices for oil and gold production in the country. Today, it ranks sixth in the world for its gold reserve having outperformed such countries as Japan, India and Great Britain. The eight major countries in the world hold almost one third of the global gold reserve, and the first twenty ones have about 90 percent.
According to the data from refineries, in 2010 Russia produced 201,715 kg of gold, including 176 448 kg of mined gold and 12 675 kg and 12 592 kg of gold coming from by-product and secondary production, respectively. Taking into account ore and concentrate exports (962.4 kg), the total of gold mined and produced in the Russia in 2010 reached 202,677 kg, or 1.3% less than in 2009 (Table 4).
Table 4
Gold production in Russia in 2004-2010
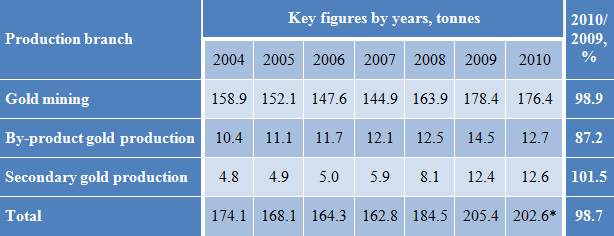
* According to the data of the Ministry of Finance of the Russian Federation including 962.4 of by-product gold exported in ores and concentrates.
Gold was mined in 24 regions of Russia of which 14 recovered more than 1 tonne (Table 5).
Table 5
Gold output in Russia’s regions in 2004-2010
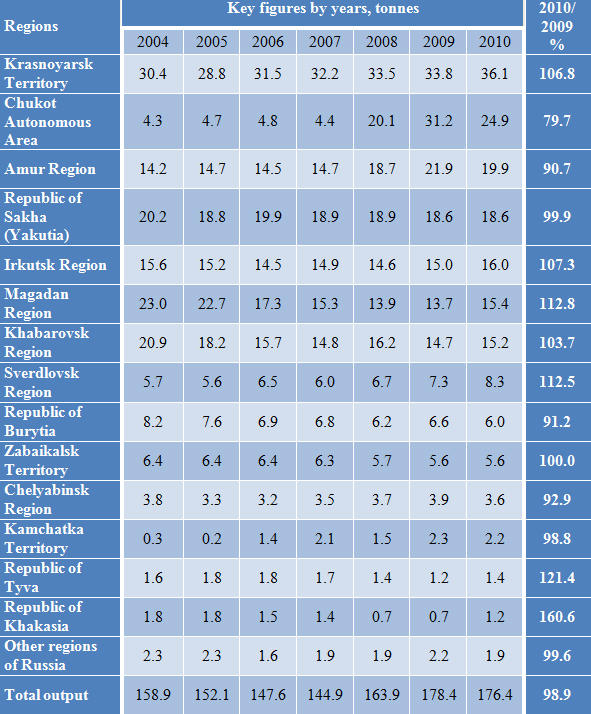
As compared to 2009, gold output growth was mainly provided by the Krasnoyarsk and Khabarovsk Territories, the Irkutsk and Magadan Regions. Among the companies that increased their output in 2010 the following ones are worth mentioning: OAO Polimetall (OAO Zoloto Severnogo Urala, OAO Okhotskaya GGK, OAO Omolonskaya ZRK and ZAO Serebro Magadana), OAO Polus Zoloto (ZAO ZDK Polus, OAO Lenzoloto), as well as OAO Vasilievsky Rudnik, OOO Sovrudnik, OAO Vysochaishy, ZAO A/s Vitim, OOO Druza, OAO Seligdar, OOO Zapadnaya, OOO Nerungri-Metallik, ZAO Rudnik Aprelkovo, OOO Malomyrsky Rudnik, OOO Kongo, OOO Status, Oina Artisan Gold Mining Team, and others.
In 2010, the following companies showed decline in gold output due to lower gold grade:
ZAO Chukotskaya GGK, OAO Pokrovsky Rudnik, OOO Berezitovy, ZAO A/s Amur, OAO Aldanzoloto, OOO Nirungan, OAO Buryatzoloto, and others.
The total gold output growth in Russia in 2008-2010 was provided mainly by the companies having an annual gold output over 5 tonnes. The total gold production of 10 major Russian companies amounted to 93.5 tonnes, or 63.1 percent of the gold production in Russia (Table 6).
Table 6
Gold production by major companies in Russia in 2008-2010
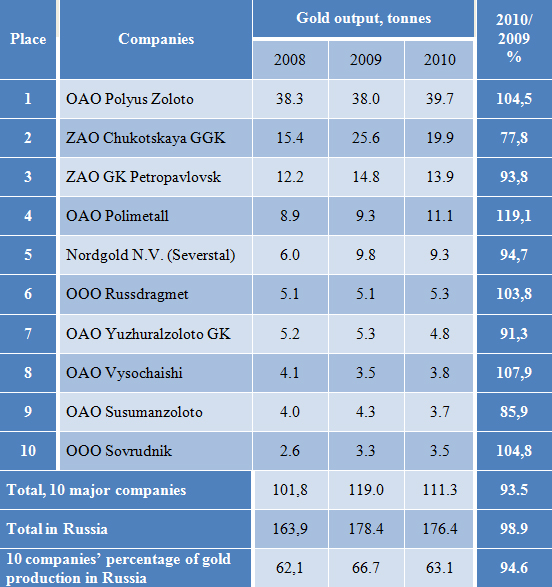
Compared to 2009, the major companies declined their output by 6.5 percent. The decrease in gold output of the major companies in Russia by 7.7 percent was mainly due to Chukotskaya GGK that declined its gold production in 2010 by 5.7 tonnes.
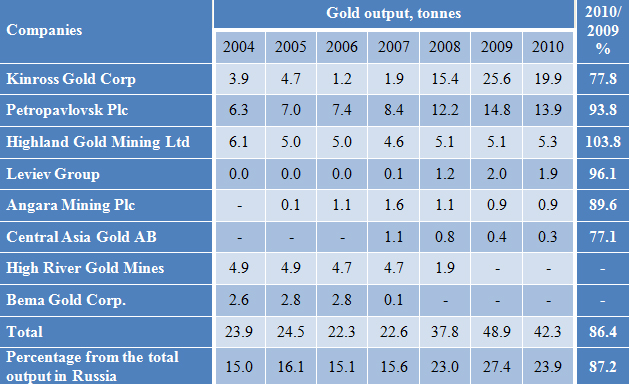
In 2010, foreign companies decreased gold output by 13.6 percent to 42 251 kg, which made 23.9 percent of the total output in Russia (Table 7).
Тable 7
Gold output of foreign companies in Russia in 2004-2010
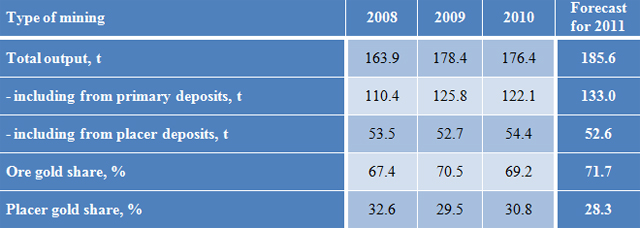
In 2010, the gold production from primary deposits declined by 3.7 tonnes (2.9%) to 122.1 tonnes, or 69.2% of the total output. Gold production from placer deposits rose by 3.2% (1.7 t) to 54.4 tonnes (30.8%) (Table 8).
Table 8
Ratio of primary to placer gold output in Russia in 2008-2010
From 2008 to 2010, gold production in the Republic of Sakha (Yakutia) practically did not grow. Ten major companies produced about 3/4 of gold in this republic (Table 9).
Table 9
Gold output of major companies in the Republic of Sakha (Yakutia) in 2008-2010
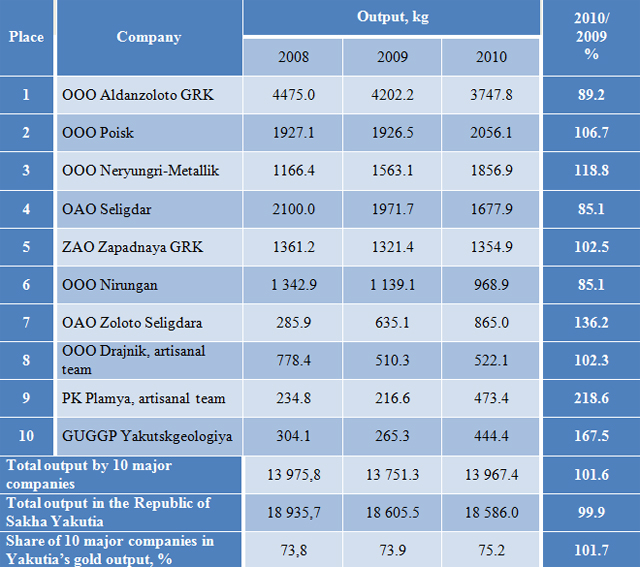 In 2010, only five companies produced over one tonne of gold. It is worth mentioning, that gold miners in Yakutia have not been stable in their performance lately due to a number of objective and subjective factors. Prospects of increasing gold production in the republic depend on modernization of the existing operations and their innovative development. So far, the sharp rise in gold prices due to instability in global economy facilitates sufficient improvement of economic performance in the gold mining industry at its existing level.
Yuri Danilov, Ph. D., Lead Research Fellow, Institute for Regional Economics of the North
